Running a small business without clear visibility into your numbers is like driving at night without headlights. You might move forward, but you won’t see what’s ahead until it’s too late. That’s where marketing analytics dashboards come in. By bringing your most important data into one place, you can quickly spot trends, measure what’s working, and make smarter decisions that drive growth.
Today, we’ll cover five must-have dashboard views every small business owner should be using: marketing performance, sales pipeline, financial health, tasks, and customer insights. You’ll also learn which KPIs to track for each, plus tips for keeping your dashboards simple yet powerful. With tools like Thryv’s Marketing Center analytics, you can go beyond surface-level metrics by tracking multi-channel campaigns, visualizing heatmaps, and staying up-to-date with the latest dashboard improvements.
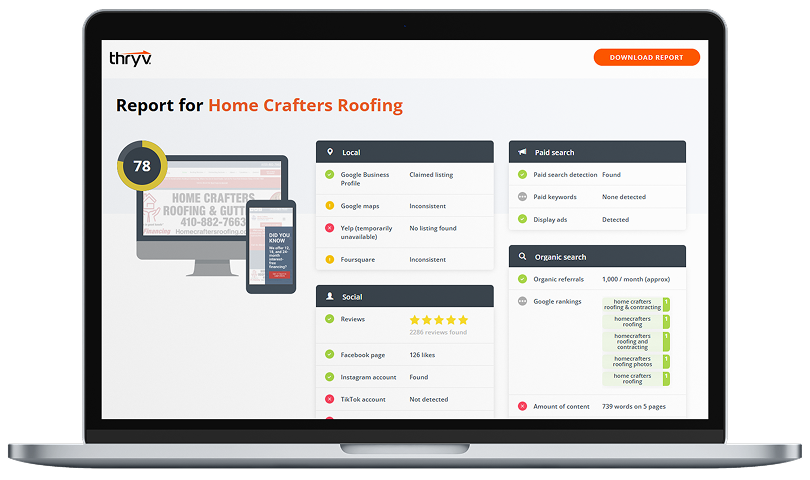
Market and Grow Your Business More Effectively With Thryv Marketing Center
Thryv Marketing Center helps you attract new customers to your business and shows you which marketing strategies work best for your customers so you don’t waste time and money on the wrong tactics.
SMB Performance Tracking
1. Marketing
2. Sales Pipeline
3. Financial Health
4. Customer Insights
5. Project Management
1. Marketing Dashboard: Track Campaign Performance
Your marketing dashboard is your small business command center. It should provide you with an instant snapshot of how your campaigns are performing across every channel, including social, search, email, and more. Key KPIs to display here include:
- Impressions and reach across platforms
- Click-through rate (CTR)
- Cost per lead (CPL) and cost per click (CPC)
- Top-performing keywords
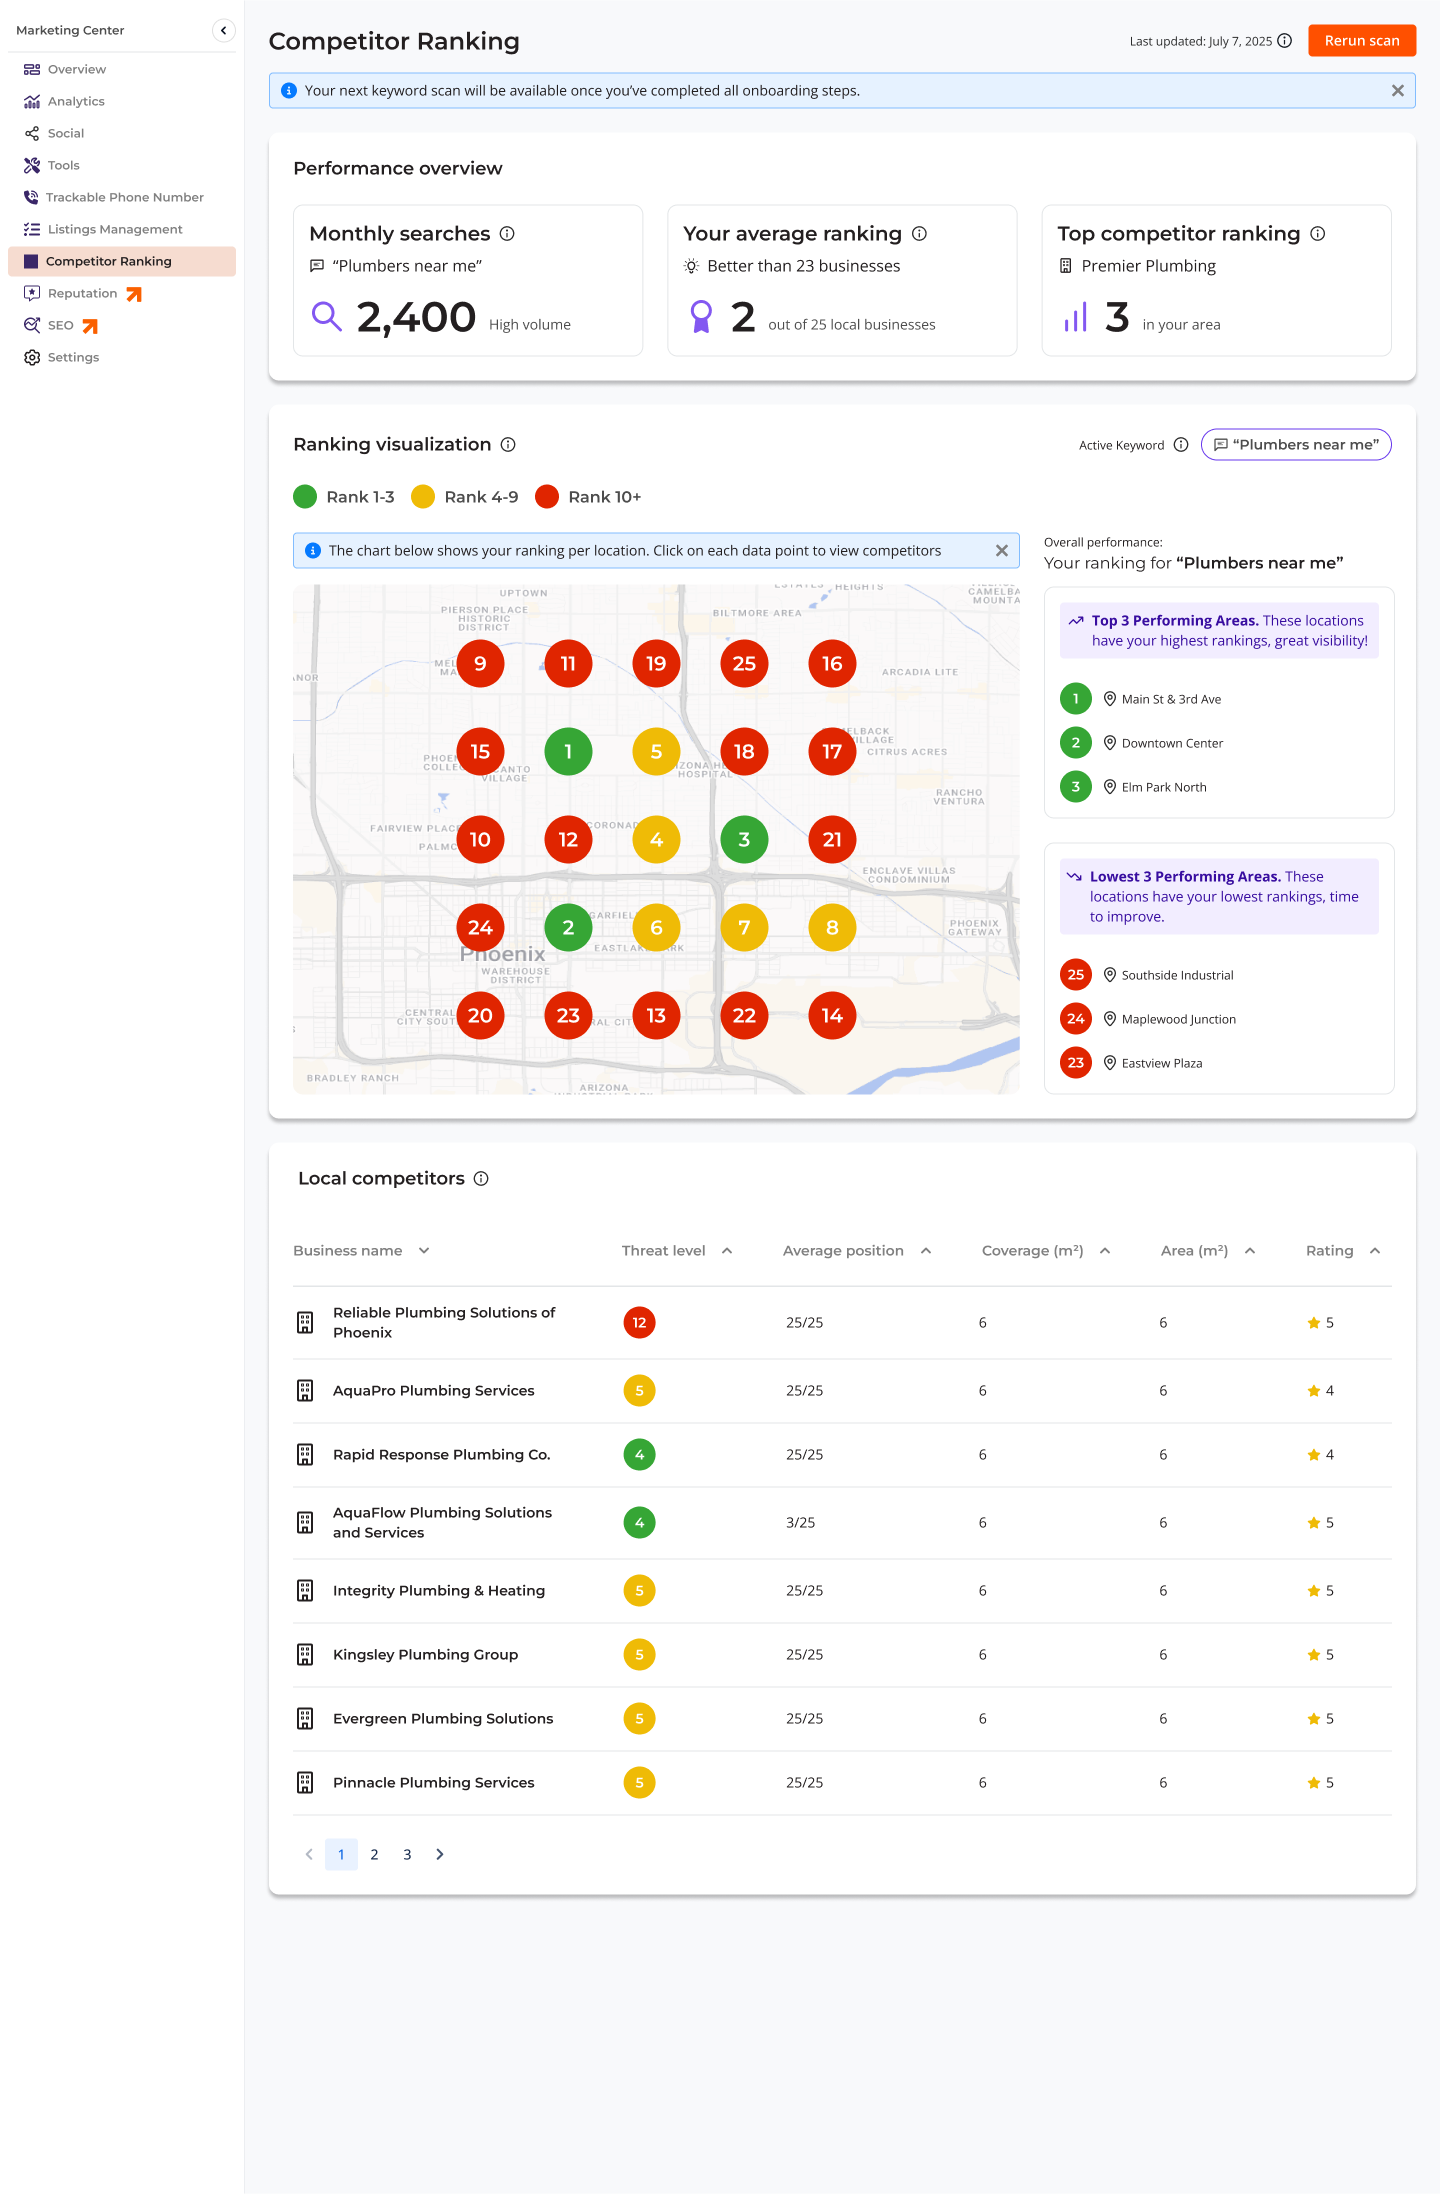
With Thryv’s Marketing Center analytics, you get multi-channel performance centralized in one dashboard. Features like heatmaps make it easy to spot which campaigns or keywords are winning in your local market. With the new Competitor Ranking tool (launching February 2026), you’ll also see how you stack up against rivals on Google Business, including which keywords to target for better visibility.
2. Sales Pipeline View: Keep Leads Moving Forward
A strong pipeline dashboard helps you see where prospects are getting stuck and how fast deals are closing. KPIs to track include:
- Number of new leads per week/month
- Conversion rates between stages
- Average deal size and sales cycle length
- Pipeline value vs. closed revenue
By layering in Thryv’s automation, you can auto-create tasks for uncontacted leads, send follow-ups, and track how campaigns are actually driving pipeline growth. This way, you’re generating leads and ensuring they move steadily toward conversion.
3. Financial Health Dashboard: Know Your Bottom Line
Marketing isn’t just about clicks; it’s about revenue. A financial health dashboard ties spend back to ROI so you can prove what’s working. Must-have KPIs include:
- Marketing spend vs. revenue generated
- Customer acquisition cost (CAC)
- Return on ad spend (ROAS)
- Lifetime value (LTV) of customers
When your financials and marketing data live in the same ecosystem, you can make smarter budget decisions faster. Thryv simplifies this by pulling analytics into a single, intuitive view that reduces time spent chasing numbers across multiple tools.
4. Customer Insights Dashboard: Understand Your Audience
Your customers leave signals everywhere, from reviews, clicks, form fills, to location searches. A customer insights dashboard consolidates these signals so you know who your best customers are and what keeps them coming back. Top KPIs to include:
- Customer demographics and behavior trends
- Net promoter score (NPS) or satisfaction ratings
- Review volume and sentiment
- Top- and lowest-performing service areas
Thryv’s Competitor Ranking goes one step further here by mapping your top and lowest-performing local service areas, helping you target growth opportunities while defending against competitors.
5. Project Management Dashboard: Stay on Top of Projects and Campaigns
Dashboards aren’t just for tracking numbers; they can also help you manage the day-to-day tasks that drive those numbers. A project or task-oriented dashboard keeps your team aligned and ensures nothing slips through the cracks. Key metrics and views to include:
- Campaign task lists with due dates and owners
- Progress tracking (percent complete per project)
- Upcoming deadlines across marketing, sales, and client work
- Bottlenecks or overdue tasks
With Thryv, small business owners can link campaign insights directly to action items. For example, if a marketing heatmap shows underperforming keywords, you can assign a task to update ad copy or create fresh content. The integration of insights and task management means you see where to improve and can immediately act on it.
Turn Data Into Decisions with Thryv
A powerful dashboard isn’t about data overload; it’s about clarity and action. With the right software in place, small businesses can spot opportunities, reduce wasted spend, and keep both marketing and operations on track. Thryv’s Marketing Center analytics make this even easier, offering centralized insights, competitor comparisons, and task-to-action integrations that keep you ahead of the curve. When your dashboards connect the dots between data and execution, you’re steering your business toward long-term success.