National Small Business Week 2026: 10 Ways to Turn One Week Into Year-Round Growth
National Small Business Week isn’t just a celebration—it’s a high-intent marketing window. Customers are actively searching for ways to support...
Social Media for Plumbers: How to Rock Online
A homeowner finds your business, checks your social profiles, and sees no recent posts or updates. Then they move on...
The Best Business Listing Management Software for Small Businesses (2026)
Managing your business listings manually across dozens of directories isn’t just tedious — it’s unsustainable. Every time your hours change, your phone number updates, or you expand...
“Near Me” Searches: Still One of the Biggest Opportunities for Local Businesses
When someone searches “services near me,” they’re not casually browsing – they’re ready to take action. Whether it’s finding a...
Get more free content to help your business.
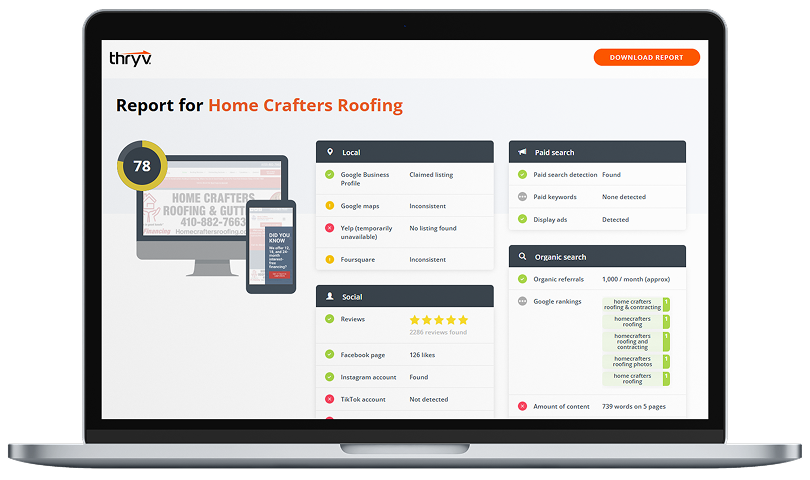
See how your business shows up online.
Enter your website URL to get your AI Digital Marketing Score, plus a personalised, downloadable report — all for free.